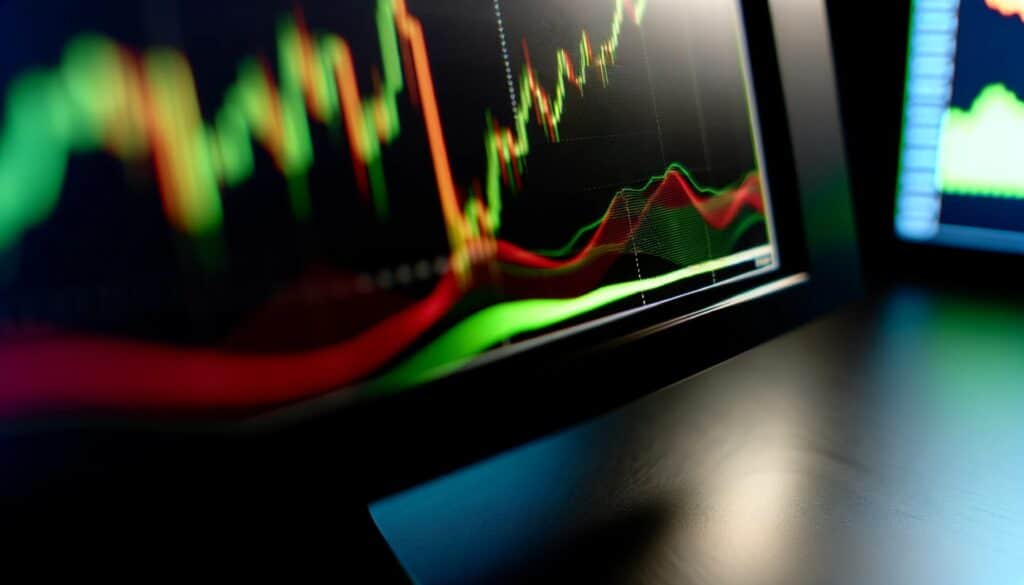

Introduction to Fibonacci Retracement
Fibonacci Retracement serves as a beacon for traders in the tempestuous seas of the Forex market, offering a semblance of order and predictability in what often seems like chaotic price movements. At its core, Fibonacci Retracement is grounded in a mathematical sequence discovered over a millennium ago by Leonardo Pisano Bigollo, famously known as Fibonacci. This sequence, characterized by each number being the sum of the two preceding ones, manifests throughout nature, art, architecture, and now, in the financial markets.
In the realm of Forex trading, Fibonacci Retracement is harnessed to identify potential levels of support and resistance, thereby offering traders valuable insights into entry and exit points. This indicator is not just a tool; it’s a principle, echoing the natural order that underpins our world. Its application in trading is a testament to the intertwined nature of mathematical patterns and market movements.
Traders employ this tool by drawing horizontal lines across a price chart at the key Fibonacci levels — typically 23.6%, 38.2%, 50%, 61.8%, and sometimes 76.4%. These levels are not arbitrary but are derived from mathematical relationships within the Fibonacci sequence. They serve as markers, or milestones, indicating where the price might pause or reverse, providing traders with strategic points to consider for their trades.
The beauty of Fibonacci Retracement lies in its versatility and applicability across different time frames and market conditions. Whether in a bullish or bearish market, the retracement levels offer a lens through which traders can decipher the underlying market sentiment and make informed decisions. It’s a tool that empowers traders to align their strategies with the natural ebb and flow of market prices, anchored in the time-tested wisdom of the Fibonacci sequence.
Yet, the power of Fibonacci Retracement extends beyond its predictive capabilities. It embodies a psychological aspect, reflecting the collective behavior and decision-making of market participants. The levels often become self-fulfilling prophecies, as numerous traders, armed with the same knowledge and tools, make decisions that inadvertently drive the market towards these predicted points.
In conclusion, Fibonacci Retracement is not merely a technical indicator; it’s a bridge between the abstract beauty of mathematics and the gritty reality of the trading floor. Its enduring relevance in Forex trading underscores the timeless nature of its underlying principles, offering traders a semblance of clarity in the inherently uncertain world of financial markets.
Understanding Fibonacci Retracement in Forex Trading
Fibonacci Retracement is a pivotal tool in the arsenal of Forex traders, offering a nuanced lens through which market dynamics can be interpreted and acted upon. This tool is predicated on the Fibonacci sequence, a series of numbers where each number is the sum of the two preceding ones (0, 1, 1, 2, 3, 5, 8, 13, 21, etc.). The significance of this sequence in Forex trading lies not in the numbers themselves but in the ratios derived from them, which exhibit a fascinating consistency across various natural and human-made systems, including financial markets.
The Essence of Fibonacci Retracement
At its essence, Fibonacci Retracement is used to identify potential reversal points (support and resistance levels) on price charts. Traders draw horizontal lines at the key Fibonacci levels (23.6%, 38.2%, 61.8%, and sometimes 76.4%) after a market move either up or down. These levels are considered to be indicative of where prices might pause or reverse, based on the historical precedent that financial markets tend to retrace a portion of their movements before continuing in the original direction.
Application in Forex Trading
In Forex trading, these retracement levels provide a framework for analyzing price action and making predictions about future movements. For instance, after a significant price increase, traders might anticipate a retracement to one of these levels before the uptrend resumes. This is grounded in the belief that the Fibonacci sequence reveals underlying patterns in human behavior and, by extension, market movements.
Strategic Planning and Decision Making
The strategic import of Fibonacci Retracement in Forex trading cannot be overstated. It aids traders in planning their entries and exits, managing risk, and setting stop-loss and take-profit orders more effectively. For example, a trader might enter a long position at a 61.8% retracement level in anticipation of the resumption of an uptrend, setting a stop-loss order just below the next Fibonacci level to minimize potential losses.
Psychological and Technical Confluence
One of the reasons Fibonacci Retracement levels are so revered among traders is their self-fulfilling nature. Because a large number of traders are observing and acting upon these levels, they often become points of psychological and technical confluence, where market sentiment and trading decisions converge, thereby reinforcing the levels’ significance.
Beyond the Basics
While Fibonacci Retracement is a powerful tool on its own, its efficacy is enhanced when used in conjunction with other technical analysis tools and indicators, such as moving averages, RSI (Relative Strength Index), and MACD (Moving Average Convergence Divergence). This multi-faceted approach allows traders to validate their predictions and make more informed decisions.
In Summary
Understanding and utilizing Fibonacci Retracement in Forex trading offers a compelling blend of mathematical harmony and market psychology. By identifying potential support and resistance levels, traders can navigate the ebbs and flows of the market with greater confidence and precision. However, it’s crucial for traders to remember that no tool can predict market movements with absolute certainty. Hence, Fibonacci Retracement should be used as part of a comprehensive trading strategy, incorporating sound risk management and a clear understanding of market conditions.
In essence, Fibonacci Retracement transcends its mathematical roots to become a vital instrument in the Forex trader’s toolkit, embodying the confluence of natural order and market sentiment.

The Mathematical Foundation of Fibonacci Retracement
The mathematical underpinning of Fibonacci Retracement in Forex trading is both fascinating and profound, rooted in the Fibonacci sequence, a series introduced to the Western world by Leonardo of Pisa, known as Fibonacci, in his 1202 AD book “Liber Abaci”. This sequence, where each number is the sum of the two preceding ones (starting from 0 and 1), forms the basis for ratios that have been observed across various natural phenomena and structures, from the branching of trees to the arrangement of leaves on a stem.
The Fibonacci Sequence and Its Significance
The sequence begins as 0, 1, 1, 2, 3, 5, 8, 13, 21, 34, and so forth. Beyond the sequence itself, the ratios derived from these numbers hold significant importance. For instance, dividing a number in the sequence by its immediate predecessor yields a ratio that approaches 1.618033988749895, known as the “Golden Ratio” or φ (phi). Conversely, the inverse of φ, or 0.618, is equally significant. These ratios, and others derived from the sequence, are omnipresent in nature, art, architecture, and, intriguingly, in the price movements observed in financial markets.
How Fibonacci Ratios are Derived
Several key ratios used in Fibonacci Retracement analysis are derived from this sequence:
- 0.236: By dividing a number in the Fibonacci sequence by the number three places to the right, the ratio approximates to 0.236 (23.6%).
- 0.382: A number divided by the number two places to the right approximates to 0.382 (38.2%).
- 0.618: This is the famed “Golden Ratio,” found by dividing a number in the sequence by its immediate predecessor, though it’s more commonly used in its percentage form, 61.8%.
- 0.786: This ratio is derived from the square root of 0.618 and is sometimes used as a retracement level.
- 1.618: The reciprocal of 0.618, also known as the “Golden Ratio,” extends beyond retracement into Fibonacci extension levels in trading.
These ratios are not arbitrary but are deeply ingrained in the fabric of the universe, manifesting in the financial markets as natural areas of support and resistance.
Application in Forex Trading
In the context of Forex trading, these ratios translate into levels that are used to predict the extent of retracements following a market movement. Traders draw horizontal lines at these key percentage points to indicate where the price might find support or resistance and potentially reverse direction.
The beauty of Fibonacci Retracement lies in its universality and the self-fulfilling prophecy it creates. Traders around the world watch these levels closely, and their collective actions at these points can lead to the anticipated market movements, reinforcing the levels’ predictive power.
In Summary
The mathematical foundation of Fibonacci Retracement is more than a mere numerical curiosity; it is a testament to the interconnectedness of natural phenomena and human behavior, including economic activities and financial markets. These mathematical principles enable traders to anticipate and react to market movements with a higher degree of precision, embedding the elegant simplicity of the Fibonacci sequence into the complex world of Forex trading.
Understanding the mathematical essence of Fibonacci Retracement not only enriches a trader’s technical analysis toolbox but also connects them to a universal pattern of growth and retracement, seen both in the natural world and in the ebb and flow of financial markets.

How to Apply Fibonacci Retracement in Trading
Applying Fibonacci Retracement in trading involves a blend of art and science, requiring an understanding of how to identify key market phases and apply the Fibonacci ratios to forecast potential reversal points. This method is widely used in Forex trading to pinpoint areas where the market may pause or reverse, offering traders insights into optimal entry and exit points. Here’s a step-by-step guide to effectively applying Fibonacci Retracement in your trading strategy.
Identifying Swing Highs and Lows
The first step in applying Fibonacci Retracement is to identify the most recent significant swing high and swing low points on your chart. These points represent the peak and trough of a price movement, respectively.
- Swing High: A swing high is a peak in price movement, characterized by a high point surrounded by two lower highs on either side.
- Swing Low: Conversely, a swing low is a trough in price movement, marked by a low point with two higher lows on either side.
Drawing Fibonacci Levels
Once you’ve identified these critical points, you can draw the Fibonacci retracement levels:
- Select the Fibonacci Retracement Tool: Most trading platforms come equipped with a Fibonacci tool.
- Draw from Swing Low to Swing High for Uptrends: If the market is in an uptrend, you’ll draw the Fibonacci retracement tool from the bottom (swing low) to the top (swing high).
- Draw from Swing High to Swing Low for Downtrends: In a downtrend, reverse the process by drawing from the swing high to the swing low.
The tool will automatically create horizontal lines at the key Fibonacci levels (23.6%, 38.2%, 61.8%, and sometimes 76.4% and 100%).
Interpreting Retracement Levels
After drawing the Fibonacci levels, the next step is interpretation, which involves analyzing how the price interacts with these levels:
- Support and Resistance: The Fibonacci levels can act as support in uptrends and resistance in downtrends. Traders look for price action signals (like candlestick patterns) at these levels to make informed decisions.
- Entry Points: Traders might consider entering the market when the price retraces to a Fibonacci level and shows signs of resuming the original trend.
- Stop Loss Orders: A common strategy is to place stop loss orders just beyond the chosen Fibonacci level to manage risk if the market moves against the anticipated direction.
- Take Profit Points: Fibonacci levels can also inform potential exit points or take profit levels, allowing traders to maximize gains based on the natural ebb and flow of market movements.
Advanced Tips for Applying Fibonacci Retracement
- Combine with Other Indicators: For increased accuracy, combine Fibonacci analysis with other indicators like MACD, RSI, or moving averages.
- Look for Confluence: Areas where Fibonacci levels overlap with other significant levels, such as long-term moving averages or pivot points, may offer stronger signals.
- Adjust to Market Conditions: Be flexible in your approach, as the effectiveness of Fibonacci Retracement can vary based on market volatility and other factors.
In Summary
Fibonacci Retracement is a powerful tool that, when applied correctly, can offer deep insights into market psychology and potential price movements. By identifying key swing highs and lows, drawing Fibonacci levels, and interpreting these levels in conjunction with other market signals, traders can enhance their trading strategy with a method grounded in mathematical elegance and market dynamics. Remember, while Fibonacci Retracement offers valuable indicators, it should be one component of a comprehensive trading strategy that includes sound risk management principles.

The Strategic Importance of Fibonacci Retracement
The strategic importance of Fibonacci Retracement in trading cannot be overstated. This tool is not just a mathematical curiosity but a fundamental part of the technical analysis toolkit that offers traders insight into market behavior. By leveraging the natural ratios derived from the Fibonacci sequence, traders can anticipate potential areas of support and resistance, making informed decisions on entry, exit, stop loss, and take profit points. Here’s a deeper look into the strategic significance of Fibonacci Retracement in the financial markets.
Support and Resistance Levels
Fibonacci Retracement levels often act as invisible barriers in the market, where significant buying or selling interest can cause prices to stall or reverse. These levels are considered crucial for the following reasons:
- Predicting Price Movements: Traders use Fibonacci levels to predict where prices might temporarily halt or reverse, providing a roadmap of potential future movements.
- Strategic Planning: Knowing potential support and resistance levels ahead of time allows traders to plan their trades more strategically, enhancing the potential for profitability.
Entry and Exit Points
One of the primary benefits of Fibonacci Retracement is its ability to suggest optimal entry and exit points:
- Entry Points: By identifying retracement levels that offer strong support or resistance, traders can pinpoint precise entry points that align with their trading strategy, whether for initiating new positions or adding to existing ones.
- Exit Points: Similarly, Fibonacci levels can indicate strategic exit points, either for taking profits or for cutting losses short, thereby helping traders to manage their risk more effectively.
Stop Loss and Take Profit Strategies
Fibonacci Retracement is instrumental in formulating stop loss and take profit strategies, which are critical for risk management:
- Stop Loss Orders: Placing stop loss orders just beyond key Fibonacci levels can help protect traders from significant losses by automatically exiting a trade if the market moves against their position.
- Take Profit Orders: Conversely, setting take profit orders at or near Fibonacci levels can enable traders to lock in profits at predetermined points, capitalizing on the market’s natural retracement patterns.
Timing Market Entries and Exits
Timing is everything in trading, and Fibonacci Retracement provides a framework for better timing decisions:
- Market Reversals: The tool helps in identifying potential reversal points after a significant price movement, offering insights into when the market momentum might shift.
- Enhancing Trading Strategies: Whether a trader prefers a conservative or aggressive approach, Fibonacci levels can be integrated into various trading strategies to improve timing and execution.
Psychological and Market Sentiment Indicator
Fibonacci Retracement levels also serve as psychological markers for traders and investors, creating self-fulfilling prophecies as market participants adjust their actions based on these universally watched levels:
- Market Sentiment: The reaction of prices at Fibonacci levels can provide insights into market sentiment, helping traders gauge whether the current trend is likely to continue or reverse.
In Summary
The strategic importance of Fibonacci Retracement extends beyond its mathematical elegance to offer practical, actionable insights into market dynamics. By identifying critical levels of support and resistance, suggesting optimal entry and exit points, and aiding in the development of robust risk management strategies, Fibonacci Retracement becomes an indispensable tool in the trader’s arsenal. However, as with all trading tools, it’s most effective when used in conjunction with other technical indicators and a well-thought-out trading plan, tailored to the trader’s individual risk tolerance and investment goals.
Fibonacci Retracement and Technical Analysis
Fibonacci Retracement is a cornerstone in the world of technical analysis, providing traders and analysts with a powerful tool to forecast future price movements based on past market behavior. This methodology is grounded in the Fibonacci sequence, a series of numbers that has been found to occur frequently in nature, art, and the financial markets. When applied to technical analysis, Fibonacci Retracement offers a predictive insight into potential support and resistance levels, acting as a complement to other technical indicators and strategies.
Combining with Other Indicators
The true power of Fibonacci Retracement in technical analysis lies in its synergy with other indicators and methods. Here’s how it integrates with various technical analysis tools:
- Moving Averages: Traders often use Fibonacci levels in conjunction with moving averages to confirm the strength of support or resistance levels. For instance, if a Fibonacci retracement level coincides with a 200-day moving average, this confluence can signal a stronger level of support or resistance.
- RSI (Relative Strength Index): The RSI is a momentum oscillator that measures the speed and change of price movements. Fibonacci levels can help identify potential reversal points, while RSI readings can indicate whether an asset is overbought or oversold at these levels.
- MACD (Moving Average Convergence Divergence): The MACD is used to identify moving averages that signal a new trend, whether it’s bullish or bearish. When a MACD crossover coincides with a price approaching a key Fibonacci level, it can provide a more reliable signal regarding the continuation or reversal of the trend.
Candlestick Patterns and Fibonacci
Candlestick patterns, when occurring at or near Fibonacci retracement levels, can offer compelling trading signals. For example, a bullish engulfing pattern at a 61.8% Fibonacci retracement level could indicate a strong buying opportunity, as it suggests a potential reversal of a downtrend.
Time Frames and Fibonacci Levels
The application of Fibonacci Retracement is not limited to any single time frame. Whether analyzing long-term weekly charts or short-term hourly charts, Fibonacci levels can provide valuable insights:
- Long-term Analysis: On longer time frames, Fibonacci levels can help identify major resistance and support levels that might not be evident through other means.
- Short-term Trading: For day traders or those looking at shorter time frames, Fibonacci retracement levels can offer quick, actionable levels for entry and exit points.
Enhancing Trading Strategies
Incorporating Fibonacci Retracement into a comprehensive trading strategy can significantly enhance decision-making processes:
- Trend Confirmation: Fibonacci levels can help confirm the strength of a trend. For instance, if the price retraces to a Fibonacci level and then continues in the direction of the trend, this can serve as a confirmation of the trend’s strength.
- Risk Management: By providing clear levels for stop-loss orders and potential take-profit points, Fibonacci Retracement helps traders manage risk more effectively.
In Summary
Fibonacci Retracement is an invaluable component of technical analysis, offering a unique blend of mathematical precision and market psychology. By identifying potential reversal points in advance, it enables traders to anticipate market movements rather than react to them. However, its greatest strength lies in its combination with other technical indicators and analysis methods, which can provide a more holistic view of the market and improve the accuracy of trading decisions. As with any trading tool, the key to success with Fibonacci Retracement lies in understanding its nuances, applying it judiciously, and integrating it into a well-rounded trading strategy.

Practical Examples of Fibonacci Retracement in Action
To understand the practical application of Fibonacci Retracement, it’s beneficial to walk through real-world examples. These scenarios illustrate how traders use Fibonacci levels to identify potential support and resistance points, thereby informing their trading decisions. Let’s explore two case studies: one in a bullish scenario and another in a bearish turnaround.
Case Study: A Bullish Scenario
Imagine a currency pair, say EUR/USD, that has been in a significant uptrend, moving from a low of 1.1000 to a high of 1.2000 over several weeks. After reaching the high, the pair begins to retrace its steps, falling back as traders take profits. This is where Fibonacci Retracement comes into play.
Application of Fibonacci Levels:
- Identifying Swing Points: The trader identifies the swing low at 1.1000 and the swing high at 1.2000.
- Drawing Fibonacci Levels: Using a Fibonacci Retracement tool, the trader draws lines at the key Fibonacci levels between these two points.
- Observing Price Action: The price starts to retrace and eventually finds support at the 61.8% Fibonacci level, around 1.1380 (1.2000 – [(1.2000 – 1.1000) * 0.618]).
Trading Decision:
- Entry Point: Seeing the price stabilize around the 61.8% level, the trader enters a long position, anticipating that the uptrend will resume.
- Stop Loss: A stop loss is placed just below the next Fibonacci level (76.4%) to minimize potential losses if the trend reversal does not occur as expected.
- Take Profit: The trader might set a take-profit order at or near the previous high of 1.2000, expecting the price to retest this level.
Case Study: A Bearish Turnaround
Consider a different scenario where the GBP/USD pair has been declining, moving from a high of 1.3500 to a low of 1.2500. As the market digests this move, the pair begins to bounce back, retracing some of its previous decline.
Application of Fibonacci Levels:
- Identifying Swing Points: The high at 1.3500 and the low at 1.2500 are identified as the significant swing points.
- Drawing Fibonacci Levels: The trader draws the Fibonacci retracement levels between these points.
- Observing Price Action: The bounce faces resistance at the 38.2% Fibonacci level, around 1.2880 (1.2500 + [(1.3500 – 1.2500) * 0.382]).
Trading Decision:
- Entry Point: Observing resistance at the 38.2% level, the trader may enter a short position, expecting the downtrend to continue.
- Stop Loss: A stop loss can be placed just above the 50% retracement level to protect against the potential for the trend to reverse.
- Take Profit: The trader sets a take-profit order at the previous low of 1.2500 or even lower, anticipating further decline.
In Summary
These practical examples highlight how Fibonacci Retracement levels can be used to forecast potential support and resistance levels, offering strategic entry and exit points. The key to effectively applying Fibonacci Retracement lies in identifying significant swing highs and lows accurately and combining this tool with other forms of technical analysis for confirmation. While not foolproof, Fibonacci Retracement provides a framework for understanding market psychology and potential price movements, making it a valuable component of a trader’s strategy.

Advanced Techniques and Tips for Using Fibonacci Retracement
Fibonacci Retracement is a versatile tool in technical analysis, offering insights into potential support and resistance levels that can inform trading decisions. For those looking to deepen their application of this technique, several advanced tips and strategies can enhance its effectiveness. Here are some advanced techniques and tips for using Fibonacci Retracement more effectively in your trading strategy.
Fibonacci Extensions and Expansions
While Fibonacci Retracement focuses on where prices might pull back to, Fibonacci Extensions and Expansions are used to identify potential points beyond the original trend. These tools project where the price could go following a retracement, offering targets for extended moves.
- How to Apply: After drawing your Fibonacci Retracement levels, you can use the Fibonacci Extension tool to project potential future price levels. For instance, after a price retraces to a Fibonacci level and then resumes its original trend, Fibonacci Extensions can help identify where the next stop might be, commonly at 161.8%, 261.8%, and 423.6% levels.
The Confluence of Fibonacci with Elliot Waves
Elliot Wave Theory posits that markets move in repetitive cycles or waves, influenced by investor psychology. Combining this theory with Fibonacci Retracement can provide a powerful analysis framework.
- Integration: Elliot Waves often retrace or extend in Fibonacci proportions. By identifying the wave patterns and applying Fibonacci levels to these patterns, traders can anticipate potential turning points with greater precision. For example, the end of a corrective wave often coincides with a significant Fibonacci retracement level of the previous impulse wave.
Using Fibonacci in Conjunction with Candlestick Patterns
Candlestick patterns, when they occur at or near Fibonacci levels, can provide strong signals for entries and exits. This combination allows traders to validate the strength of a Fibonacci level with the immediate price action reflected in the candlestick formation.
- Application: Look for reversal candlestick patterns (like doji, hammer, engulfing patterns) at Fibonacci retracement levels for additional confirmation of potential support or resistance. This method increases the likelihood that the price will react to these levels.
Adjusting for Market Context
The effectiveness of Fibonacci Retracement can vary depending on the market context and volatility. Adjust your strategy accordingly:
- Market Context: Consider the overall trend and market conditions before applying Fibonacci levels. In strong trending markets, retracements to the 38.2% or 50% levels may be more relevant, while in more volatile conditions, deeper retracements to the 61.8% or 76.4% levels may occur.
- Volatility Adjustments: In highly volatile markets, widen your stop-loss orders to accommodate larger price swings and avoid being prematurely stopped out of your position.
Time Frame Analysis
Applying Fibonacci Retracement across multiple time frames can offer a more nuanced view of potential support and resistance levels.
- Multiple Time Frames: Start with a long-term chart to identify major levels of interest, then drill down to shorter time frames to fine-tune entry and exit points. Confluence of Fibonacci levels across different time frames can indicate stronger areas of support or resistance.
In Summary
Advanced techniques for using Fibonacci Retracement involve a deeper integration with other technical analysis tools and a nuanced understanding of market dynamics. By applying these advanced strategies, traders can enhance their ability to predict price movements and improve their trading outcomes. Remember, no tool or technique guarantees success in trading; they should be used as part of a comprehensive trading plan that includes sound risk management practices.
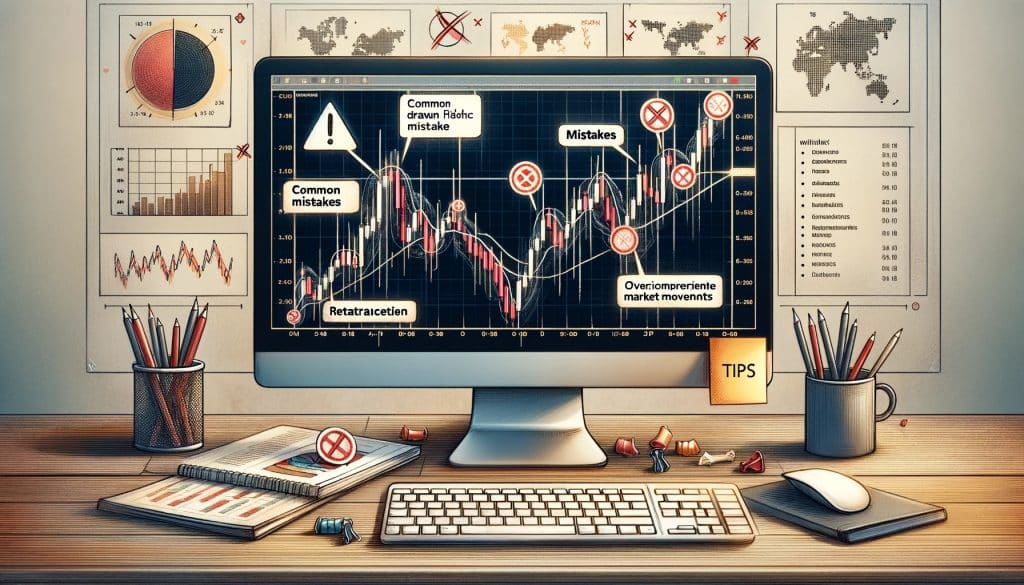
Common Mistakes to Avoid with Fibonacci Retracement
Fibonacci Retracement is a widely used tool in technical analysis for identifying potential support and resistance levels, yet its effectiveness can be compromised by common mistakes. Avoiding these pitfalls can enhance your trading strategy and improve your ability to make informed decisions. Here are some of the most frequent errors traders make when using Fibonacci Retracement and how to avoid them.
Incorrectly Identifying Swing Highs and Lows
One of the foundational steps in using Fibonacci Retracement is accurately identifying the relevant swing highs and lows from which to draw the retracement levels.
- Avoidance Tip: Take time to study the chart and ensure you’re selecting significant swing points. The most relevant highs and lows are those that represent a substantial change in price direction.
Overreliance on Fibonacci Levels
While Fibonacci levels can provide valuable insights, they should not be used in isolation. Relying solely on these levels without considering other market factors can lead to poor trading decisions.
- Avoidance Tip: Always corroborate Fibonacci signals with other forms of technical analysis, such as trend lines, moving averages, and volume indicators, to confirm your trading strategy.
Ignoring the Overall Market Trend
Fibonacci Retracement is most effective when used in the context of the overall market trend. Ignoring the trend can result in misinterpreting retracement levels as reversal signals.
- Avoidance Tip: Always align your Fibonacci trading strategy with the prevailing market trend. Remember, retracements are short-term price corrections within a larger trend.
Setting Stop Losses Too Tight
A common mistake is placing stop-loss orders too close to the Fibonacci level, not allowing for the natural market volatility.
- Avoidance Tip: Give your trades enough room to breathe by setting stop losses slightly beyond the nearest Fibonacci levels or based on other technical indicators or recent price action.
Failing to Adjust to Changing Market Conditions
Market conditions evolve, and what worked in the past may not work in the future. Adhering rigidly to the same Fibonacci levels without considering changes in volatility or market dynamics can lead to missed opportunities or increased risk.
- Avoidance Tip: Regularly review and adjust your trading strategy to reflect current market conditions and volatility. Be flexible and ready to adapt your use of Fibonacci levels as needed.
Misinterpreting Retracement for Reversal
Traders sometimes mistake a retracement for a trend reversal, leading to premature or misguided trades.
- Avoidance Tip: Use additional indicators to distinguish between a retracement (a temporary price movement against the trend) and a reversal (a significant change in price direction). Look for confirmation through patterns, volume analysis, or other technical indicators.
Not Using Confluence
Fibonacci levels are most powerful when they coincide with other technical indicators or significant price levels, creating a confluence of signals.
- Avoidance Tip: Look for areas where Fibonacci levels align with other significant factors, such as pivot points, moving averages, or previous support and resistance levels, to identify stronger trade setups.
In Summary
Avoiding these common mistakes with Fibonacci Retracement can significantly improve the precision and effectiveness of your trading strategy. By integrating Fibonacci analysis with a comprehensive understanding of market trends, technical indicators, and sound risk management practices, traders can navigate the complexities of the market with greater confidence and success.

Fibonacci Retracement in Various Market Conditions
Fibonacci Retracement is a versatile tool in technical analysis, adaptable to various market conditions. Its effectiveness lies in identifying potential support and resistance levels, providing traders with insights that aid in decision-making across trending, ranging, and volatile market environments. Understanding how to apply Fibonacci Retracement in these different conditions can significantly enhance trading strategies.
Trending Markets
In trending markets, Fibonacci Retracement levels can serve as key indicators for entry and exit points.
- Uptrends: During an uptrend, traders can draw Fibonacci lines from a recent swing low to a swing high. The retracement levels offer potential support zones where traders might consider buying, anticipating a continuation of the trend.
- Downtrends: Conversely, in a downtrend, Fibonacci levels are drawn from a swing high to a swing low. The retracement levels then act as resistance zones, where selling opportunities may arise, expecting the downtrend to resume.
Strategy Tip: Look for retracement levels that align with other indicators, such as moving averages or trend lines, to confirm potential reversal points within the trend.
Ranging Markets
In markets that are ranging or moving sideways, Fibonacci Retracement can help identify levels of potential support and resistance within the range.
- Application: By identifying the range boundaries (the high and low points of the range), traders can apply Fibonacci levels to gauge where price movements might pause or reverse within the range.
- Strategy Tip: Use Fibonacci Retracement levels to pinpoint potential entry and exit points, buying near support levels, and selling near resistance levels, within the range. Combining Fibonacci levels with oscillators like RSI or Stochastic can help validate these potential turning points.
Volatile Markets
Volatile markets are characterized by rapid and significant price movements. While this environment increases risk, it also opens up opportunities for adept traders.
- Application: In highly volatile markets, Fibonacci Retracement levels can help identify more substantial support and resistance areas where price swings might exhaust themselves, offering entry or exit points.
- Strategy Tip: Due to the increased price swings, it’s crucial to use wider stop-loss margins to avoid being prematurely stopped out of positions. Combining Fibonacci levels with volume indicators can provide additional insights into the strength of support or resistance at these levels.
Adjusting Fibonacci Levels
- Custom Levels: Some traders adjust the standard Fibonacci levels to better fit their analysis or the specific characteristics of the market they are trading. For instance, adding levels such as 76.4% or custom percentages based on historical price behavior of the asset.
- Psychological Levels: Incorporating round numbers or significant psychological levels in conjunction with Fibonacci retracement can enhance the relevance of these levels, as market participants often place orders around such numbers.
In Summary
Fibonacci Retracement is a dynamic tool that, when adjusted and applied thoughtfully, can provide valuable insights across various market conditions. Whether dealing with trends, ranges, or volatility, Fibonacci levels offer a structured way to analyze price movements. The key to maximizing its benefits lies in combining it with other technical analysis tools and adapting strategies to suit the prevailing market environment, ensuring that decisions are informed and risk is managed effectively.
Fibonacci Retracement vs Other Forex Indicators
In the diverse world of Forex trading, Fibonacci Retracement stands out as a unique tool based on mathematical ratios derived from the Fibonacci sequence. However, it’s just one of many tools traders use to predict market movements and make informed decisions. Understanding how Fibonacci Retracement compares to other popular Forex indicators can help traders develop a more rounded and effective trading strategy.
Comparison with Moving Averages
- Nature and Application: Moving Averages (MAs) smooth out price data to create a single flowing line, which makes it easier to identify the direction of the trend. Fibonacci Retracement, on the other hand, provides specific levels of potential support and resistance based on previous price movements.
- Use in Trading: While MAs help identify the trend direction and potential reversal points over time, Fibonacci Retracement offers precise entry and exit points during retracements within a trend. Combining the two can offer a robust strategy, using MAs for trend identification and Fibonacci levels for trading within those trends.
RSI (Relative Strength Index) and Fibonacci Retracement
- Nature and Application: RSI is a momentum oscillator that measures the speed and change of price movements, typically used to identify overbought or oversold conditions. Fibonacci Retracement, in contrast, focuses on the price levels themselves, not the speed or momentum of the movements.
- Use in Trading: RSI can be used in tandem with Fibonacci Retracement to confirm entry points. For example, an oversold RSI reading at a significant Fibonacci support level might indicate a strong buying opportunity.
Bollinger Bands and Fibonacci Levels
- Nature and Application: Bollinger Bands consist of a middle band being an MA, with two outer bands that are standard deviations away from the middle band, used to measure market volatility. Fibonacci Retracement levels are static, providing potential support and resistance levels.
- Use in Trading: When the price touches or approaches a Fibonacci Retracement level and simultaneously interacts with one of the Bollinger Bands (either pushing against or breaking through), it can signal strength or weakness at that price level, helping to inform trades.
MACD (Moving Average Convergence Divergence) and Fibonacci Retracement
- Nature and Application: MACD is a trend-following momentum indicator that shows the relationship between two moving averages of a currency’s price. It’s used to identify potential buy or sell signals through crossovers and divergence. Fibonacci Retracement, however, provides static levels that predict where prices may find support or resistance.
- Use in Trading: MACD can signal the start of a new trend or the end of an existing one, while Fibonacci levels can help traders decide at what points within that trend they might want to enter or exit a trade.
Pivot Points vs. Fibonacci Retracement
- Nature and Application: Pivot Points are used to determine overall market trends over different time frames. They’re calculated based on the high, low, and close of the previous trading day. Fibonacci Retracement levels are derived from the vertical distance between two extreme points (high and low) and are used to identify potential reversal points.
- Use in Trading: Both tools can be used to identify potential support and resistance levels, but while Pivot Points offer a broader view of market sentiment, Fibonacci Retracement provides more granular insight into price movement and retracement levels.
In Summary
Fibonacci Retracement is unique in its mathematical basis and its focus on specific price levels rather than trends or momentum. However, it’s most powerful when used in conjunction with other indicators, providing a more comprehensive view of the market. No single indicator should be used in isolation, as integrating various tools can help traders confirm signals, reduce risk, and increase the potential for profitable trades.
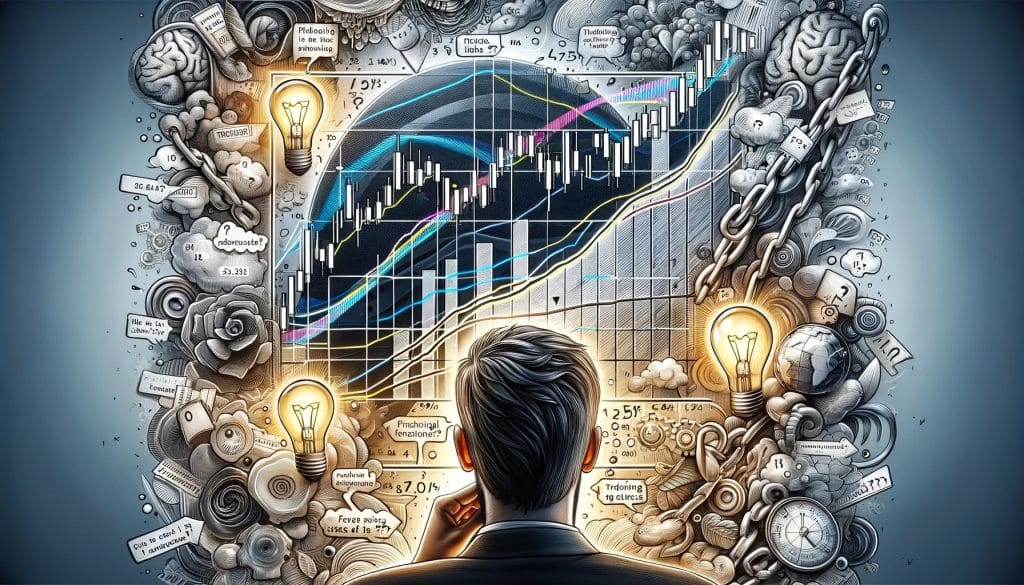
The Psychological Aspect of Fibonacci Retracement in Trading
The effectiveness of Fibonacci Retracement in trading extends beyond its mathematical foundation, deeply entwining with the psychological behaviors of market participants. This intersection of numerical analysis and human psychology forms a cornerstone of its widespread use and reliability as a trading tool. Understanding the psychological underpinnings can enhance a trader’s ability to leverage Fibonacci levels more effectively.
Market Psychology and Fibonacci Levels
Fibonacci Retracement levels, derived from the natural and mathematical Fibonacci sequence, resonate with traders due to their frequent occurrence in natural and human-made structures. This familiarity breeds a level of psychological comfort and trust in these levels as natural points of market reversal or continuation.
Self-Fulfilling Prophecy
A significant aspect of the psychological impact of Fibonacci Retracement is the concept of the self-fulfilling prophecy. Many traders and analysts observe these levels and make trading decisions based on their expectations of price action at these points. This collective action can drive market movements that align with the predicted Fibonacci levels, reinforcing their validity and effectiveness.
- Trader Expectations: When a large number of traders expect resistance or support at a certain Fibonacci level and act accordingly (by placing buy or sell orders), their collective actions can cause the market to react in the anticipated manner.
- Market Sentiment: Fibonacci levels can also act as psychological markers that influence market sentiment. For example, a failure to break through a key Fibonacci resistance level might be viewed as a bearish signal, while finding support at a Fibonacci level could bolster bullish sentiment.
Risk Management and Decision Making
The psychological aspect of trading with Fibonacci levels extends to risk management and decision-making processes. Traders often use these levels to set stop-loss orders and take-profit points, reflecting a collective acknowledgment of their significance.
- Psychological Comfort: Setting stop losses just beyond a Fibonacci level can provide a psychological buffer, giving the market room to “test” these levels without prematurely stopping out a position.
- Profit Taking: Similarly, the anticipation of resistance at a certain Fibonacci level can lead traders to set take-profit orders near these levels, aiming to capitalize on the expected reversal or slowdown in price movement.
Confirmation Bias
Traders might fall into the trap of confirmation bias, where they give more weight to market movements that confirm the Fibonacci levels while ignoring those that don’t. This psychological bias can skew perception and decision-making.
- Awareness and Balance: Being aware of confirmation bias is crucial. Traders should seek out additional confirmation from other indicators and market analysis techniques to make more balanced and informed decisions.
In Summary
The psychological aspect of Fibonacci Retracement plays a pivotal role in its application in trading. The collective belief in the significance of these levels, fueled by their mathematical rationale and historical performance, can influence market behavior in ways that align with the predictions based on Fibonacci analysis. However, a successful trader recognizes the importance of combining this psychological insight with comprehensive market analysis, using Fibonacci levels as one of several tools to guide trading decisions in a disciplined and balanced trading strategy.

Automating Fibonacci Retracement: Tools and Software
Automating Fibonacci Retracement involves leveraging technology to simplify the process of applying Fibonacci levels to trading charts, enhancing efficiency, and accuracy in identifying potential support and resistance levels. Several tools and software platforms have been developed to cater to this need, integrating Fibonacci analysis into their suite of technical analysis tools. Here’s how automation is transforming the use of Fibonacci Retracement in trading and the types of tools available for traders.
Benefits of Automation
- Speed and Efficiency: Automated tools can instantly apply Fibonacci Retracement levels to any chart, saving traders a significant amount of time.
- Accuracy: Manual drawing of Fibonacci levels can be prone to errors, especially in fast-moving markets. Automation ensures that the levels are precisely calculated and applied.
- Consistency: Automated tools apply Fibonacci levels in a consistent manner, adhering to the same standards across different time frames and assets.
Types of Tools and Software
Trading Platforms with Built-in Fibonacci Tools
Many advanced trading platforms incorporate Fibonacci Retracement tools as part of their standard offerings. These platforms allow traders to select the tool and apply it between two points (usually a high and a low point) on a price chart, automatically generating the retracement levels.
- MetaTrader 4/5: Widely used for Forex trading, these platforms offer extensive technical analysis tools, including Fibonacci Retracement, allowing traders to apply these levels with a few clicks.
- TradingView: A popular web-based charting platform that offers comprehensive drawing tools, including Fibonacci Retracement, with advanced customization options.
- Thinkorswim: Offered by TD Ameritrade, this platform provides robust charting and analysis tools, including automated Fibonacci Retracement levels, for various asset classes.
Custom Indicators and Scripts
For those seeking more customization or specific features in their Fibonacci analysis, custom indicators and scripts can be written or downloaded.
- MQL4/5 for MetaTrader: Traders can write their own scripts in the MetaTrader platform’s native programming language (MQL4 for MT4, MQL5 for MT5) or download custom indicators created by the community.
- Pine Script for TradingView: Users can create custom scripts in Pine Script to automate Fibonacci Retracement analysis and integrate it with other indicators for more comprehensive strategies.
Automated Trading Bots
Some traders use automated trading bots that incorporate Fibonacci levels into their decision-making algorithms. These bots can execute trades based on the interaction of prices with predefined Fibonacci levels, among other criteria.
- Custom Bots: Traders with programming knowledge can develop their own trading bots that use Fibonacci Retracement levels as part of their trading logic.
- Commercial Bots: There are also commercial options available that include Fibonacci-based strategies as part of their offerings.
Considerations for Automated Fibonacci Tools
While automated tools offer significant advantages, traders should be mindful of a few considerations:
- Market Context: Automation does not account for market context. Traders should still perform a comprehensive analysis to ensure that their strategies align with overall market conditions.
- Tool Limitations: Not all tools are created equal. Traders should explore different options to find the tool that best fits their trading style and needs.
- Overreliance: Relying solely on automated Fibonacci levels without considering other analysis methods or market factors can lead to suboptimal trading decisions.
In Summary
Automating Fibonacci Retracement analysis can greatly enhance a trader’s efficiency and accuracy, offering quick and precise identification of key levels across different markets and assets. By incorporating these tools into a broader trading strategy, traders can leverage the predictive power of Fibonacci levels while mitigating some of the challenges associated with manual analysis.

Learning and Mastering Fibonacci Retracement
Fibonacci Retracement is a powerful tool in the technical analysis toolkit, offering insights into potential support and resistance levels based on the Fibonacci sequence, a series of numbers derived from the natural world. Mastering this tool requires not only an understanding of how to apply it to trading charts but also an appreciation of its limitations and nuances. Here’s a guide to learning and mastering Fibonacci Retracement for trading.
Understanding the Fibonacci Sequence and Ratios
The first step in mastering Fibonacci Retracement is to understand the mathematical basis behind it. The Fibonacci sequence starts with 0 and 1, and each subsequent number is the sum of the two preceding ones (0, 1, 1, 2, 3, 5, 8, 13, 21, etc.). In trading, the key Fibonacci ratios (23.6%, 38.2%, 61.8%, and sometimes 76.4%) are derived from mathematical relationships within this sequence.
Applying Fibonacci Retracement to Charts
Learning how to correctly apply Fibonacci Retracement to price charts is crucial. This involves identifying significant price movements and applying the retracement tool from the swing high to swing low in a downtrend, or vice versa in an uptrend. Practice is key to becoming proficient in identifying the right swing points and drawing the retracement levels accurately.
Best Practices for Using Fibonacci Retracement
- Combine with Other Analysis Tools: Fibonacci Retracement should not be used in isolation. Combine it with other technical analysis tools like trend lines, RSI, MACD, and candlestick patterns for a more comprehensive market analysis.
- Look for Confluence: The most significant Fibonacci levels are those that coincide with other technical indicators or significant price levels, such as previous highs/lows or moving averages.
- Consider the Overall Trend: Fibonacci Retracement is most effective when used in the context of the prevailing market trend. Always consider the larger trend before making trading decisions based on retracement levels.
Learning Resources
- Books: Start with foundational texts on technical analysis and specific works on Fibonacci and its application in trading.
- Online Courses: Many online platforms offer courses ranging from beginner to advanced levels focused on technical analysis and specifically on using Fibonacci Retracement.
- Webinars and Workshops: Look for webinars and workshops offered by experienced traders and financial institutions that provide practical insights into using Fibonacci Retracement effectively.
Practice Strategies for Improvement
- Demo Trading: Use a demo trading account to practice applying Fibonacci Retracement to live market conditions without financial risk. This allows you to refine your technique and build confidence.
- Backtesting: Test your Fibonacci-based strategies on historical data to see how they would have performed. This can help you understand the conditions under which these strategies work best.
- Journaling: Keep a trading journal documenting your Fibonacci trades, including your rationale for entry and exit and the outcome. Reviewing your journal can provide valuable insights into your trading patterns and areas for improvement.
Advanced Topics in Fibonacci Trading
As you become more comfortable with the basics, explore advanced topics such as Fibonacci extensions, expansions, and the integration of Fibonacci with Elliott Wave Theory. These areas can provide deeper insights into market movements and further refine your trading strategies.
In Summary
Mastering Fibonacci Retracement is a journey that combines theoretical knowledge with practical application. By understanding the mathematical principles behind it, practicing its application in real and simulated environments, and continuously learning from both successes and failures, traders can effectively incorporate Fibonacci Retracement into a well-rounded trading strategy. Remember, the key to success lies in consistent practice, ongoing learning, and the integration of Fibonacci analysis with other technical and fundamental analysis tools.

Expert Opinions on Fibonacci Retracement
Fibonacci Retracement is a tool that has garnered respect and skepticism in equal measure within the trading community. Its application in technical analysis draws on the Fibonacci sequence, a series of numbers that has fascinated mathematicians, scientists, and artists for centuries. In financial markets, this sequence is used to predict potential support and resistance levels during retracements. Here, we explore expert opinions on the efficacy and application of Fibonacci Retracement in trading.
Supporting Views
Many trading experts and seasoned investors hold Fibonacci Retracement in high regard, emphasizing its utility in identifying strategic points for transactions.
- Predictive Power: Proponents argue that Fibonacci Retracement levels often coincide with key turning points in the markets, offering predictive insights that can guide trading decisions.
- Universal Application: Supporters highlight its versatility, noting that it can be applied across various asset classes, including stocks, forex, commodities, and cryptocurrencies, and within different time frames, from intraday to long-term analysis.
- Psychological Significance: Some experts point out the psychological aspect of Fibonacci levels, suggesting that because many traders watch these levels and make decisions based on them, they become self-fulfilling prophecies.
Skeptical Perspectives
Despite its popularity, some market analysts and academics are skeptical about the reliability and scientific basis of using Fibonacci Retracement in trading.
- Subjectivity in Application: Critics argue that the identification of swing highs and lows, crucial for drawing Fibonacci levels, can be highly subjective and vary between traders, potentially leading to inconsistent results.
- Lack of Empirical Evidence: Skeptics often point to the lack of conclusive empirical evidence supporting the effectiveness of Fibonacci Retracement as a predictive tool, suggesting that any success might be more attributable to chance or other market factors.
- Overreliance Risk: There’s concern that traders might over-rely on Fibonacci levels, neglecting other important aspects of technical analysis and market fundamentals, which could lead to flawed trading strategies.
Balanced Views
Between the extremes of unwavering support and outright skepticism, many experts adopt a more balanced view on Fibonacci Retracement.
- One Tool Among Many: Most seasoned traders view Fibonacci Retracement as one tool in a comprehensive trading toolkit. They advocate for its use in conjunction with other technical indicators, fundamental analysis, and a solid understanding of market conditions.
- Risk Management: Even supporters of Fibonacci Retracement emphasize the importance of using it as part of a disciplined approach to risk management, advising traders not to base decisions solely on Fibonacci levels without considering stop-loss strategies and portfolio diversification.
Expert Advice for Using Fibonacci Retracement
- Continuous Learning and Adaptation: Experts advise traders to continuously educate themselves, not only about Fibonacci Retracement but also about the broader context of market analysis and trading psychology.
- Practical Application and Experience: Gaining practical experience through paper trading or small positions can help traders understand how Fibonacci levels interact with market movements and refine their strategies accordingly.
In Summary
Expert opinions on Fibonacci Retracement reflect a spectrum of views, from strong advocacy based on its perceived predictive power to skepticism about its empirical validity. The consensus among many professionals is to use Fibonacci Retracement as part of a diversified trading strategy, complemented by other analysis methods and sound risk management practices. Regardless of one’s stance, the continued discussion and debate over Fibonacci Retracement underscore its enduring intrigue and relevance in the complex world of trading.

Future Trends in Fibonacci Retracement Application
The application of Fibonacci Retracement in trading and technical analysis is expected to evolve with advancements in technology, increased market data availability, and the integration of artificial intelligence (AI) and machine learning (ML) in trading platforms. Here’s a look at some potential future trends in the application of Fibonacci Retracement.
Integration with Artificial Intelligence and Machine Learning
AI and ML are set to revolutionize the way traders use Fibonacci Retracement, enhancing its predictive power and accuracy.
- Automated Pattern Recognition: AI algorithms could automate the process of identifying key swing highs and lows, reducing subjectivity and potentially increasing the accuracy of Fibonacci level placement.
- Predictive Analytics: ML models may learn from vast amounts of historical data to predict how markets are likely to react to certain Fibonacci levels, taking into account various factors like market conditions, sentiment, and economic indicators.
Enhanced User Interfaces for Technical Analysis Platforms
As trading platforms become more sophisticated, the integration and visualization of Fibonacci Retracement tools are likely to improve, making them more accessible to traders.
- Customizable Tools: Future platforms may offer more customizable Fibonacci tools, allowing traders to adjust settings according to their trading strategies or to highlight certain levels that have historically been more significant for specific assets.
- Interactive Charts: Enhanced interactive charts could allow traders to dynamically apply and adjust Fibonacci levels, integrating real-time data feeds to instantly analyze potential support and resistance levels.
Blockchain and Decentralized Finance (DeFi)
The rise of blockchain technology and DeFi markets opens new avenues for the application of Fibonacci Retracement, especially in cryptocurrencies and tokenized assets.
- Cross-Market Analysis: Traders might use Fibonacci Retracement across both traditional financial markets and emerging DeFi platforms, analyzing patterns and correlations that could offer unique trading opportunities.
- Smart Contracts for Trading Strategies: Smart contracts could be programmed with strategies that automatically execute trades based on specific reactions to Fibonacci levels, further automating the trading process.
Educational Resources and Community Knowledge Sharing
The digital age facilitates the sharing of knowledge and trading strategies like never before, which will likely lead to a deeper collective understanding of Fibonacci Retracement.
- Online Learning Platforms: An increase in specialized online courses and webinars focused on advanced Fibonacci trading strategies is expected, making expert knowledge more accessible to retail traders.
- Community-Driven Analytics: Social trading platforms and forums where traders share insights and strategies could lead to the development of new, community-validated approaches to using Fibonacci Retracement.
Regulatory and Ethical Considerations
As the application of advanced technologies in trading grows, so will the focus on regulatory and ethical considerations.
- Transparency and Fairness: Regulators may develop guidelines to ensure that the use of AI and ML in trading, including strategies based on Fibonacci Retracement, is transparent, ethical, and does not disadvantage retail traders.
- Data Privacy: With increased data collection and analysis, ensuring the privacy and security of trader data will be paramount.
In Summary
The future of Fibonacci Retracement application looks promising, with technological advancements poised to enhance its utility and effectiveness in trading strategies. As AI and ML technologies become more integrated into technical analysis and trading platforms, traders could see a significant improvement in the accuracy and applicability of Fibonacci Retracement. However, the evolution of this tool will also require a thoughtful consideration of ethical, regulatory, and educational aspects to ensure its benefits are maximized across the trading community.

Conclusion: The Timeless Value of Fibonacci Retracement in Forex
The Fibonacci Retracement tool, grounded in the mathematical elegance of the Fibonacci sequence, has established itself as a timeless and invaluable resource in the arsenal of Forex traders. Its application extends beyond mere technical analysis, intertwining with the psychological fabric of market dynamics and offering a unique perspective on potential support and resistance levels. As we reflect on the enduring value of Fibonacci Retracement in Forex trading, several key points underscore its significance.
Mathematical Harmony and Market Psychology
The Fibonacci sequence, a series of numbers derived from nature, resonates through the Fibonacci Retracement tool, providing a bridge between the natural world’s mathematical harmony and the often chaotic movements of the Forex market. This connection not only lends a sense of order and predictability to market analysis but also taps into the collective psychology of market participants, reinforcing the self-fulfilling nature of these levels.
Versatility Across Time Frames and Markets
One of the most compelling attributes of Fibonacci Retracement is its versatility. Applicable across various time frames, from intraday to long-term analysis, and adaptable to different market conditions, it offers traders a flexible tool that remains relevant regardless of trading style or strategy. Its utility is not confined to the Forex market alone but extends to stocks, commodities, and the burgeoning field of cryptocurrencies, illustrating its broad applicability.
Integration with Other Technical Analysis Tools
The strength of Fibonacci Retracement is amplified when used in conjunction with other technical analysis tools. Whether it’s confirming trend directions with moving averages, identifying potential reversals with candlestick patterns, or corroborating overbought or oversold conditions with oscillators like RSI, Fibonacci Retracement enhances the trader’s ability to make informed decisions, grounded in a multifaceted analysis of market conditions.
Adaptation to Technological Advancements
As trading evolves with technological advancements, the application of Fibonacci Retracement continues to adapt and thrive. The integration of artificial intelligence and machine learning offers new frontiers for automating and refining the use of Fibonacci levels, promising greater accuracy and efficiency in identifying trading opportunities. Moreover, the rise of online platforms and trading communities fosters a collaborative environment for sharing strategies and insights, further enriching the knowledge base surrounding Fibonacci trading.
The Path Forward
The timeless value of Fibonacci Retracement in Forex trading is a testament to its foundational principles, which balance mathematical precision with an understanding of human behavior. As traders navigate the complexities of the Forex market, the Fibonacci Retracement tool serves as a compass, guiding strategies with its predictive insights. However, the true mastery of Fibonacci Retracement lies in the trader’s ability to blend this tool with comprehensive market analysis, sound risk management practices, and continuous learning.
In conclusion, Fibonacci Retracement embodies a unique confluence of mathematical beauty, market psychology, and practical trading utility. Its enduring relevance in Forex trading underscores not only the timeless appeal of the Fibonacci sequence but also the evolving nature of financial markets, where the quest for predictive accuracy and strategic edge remains paramount.
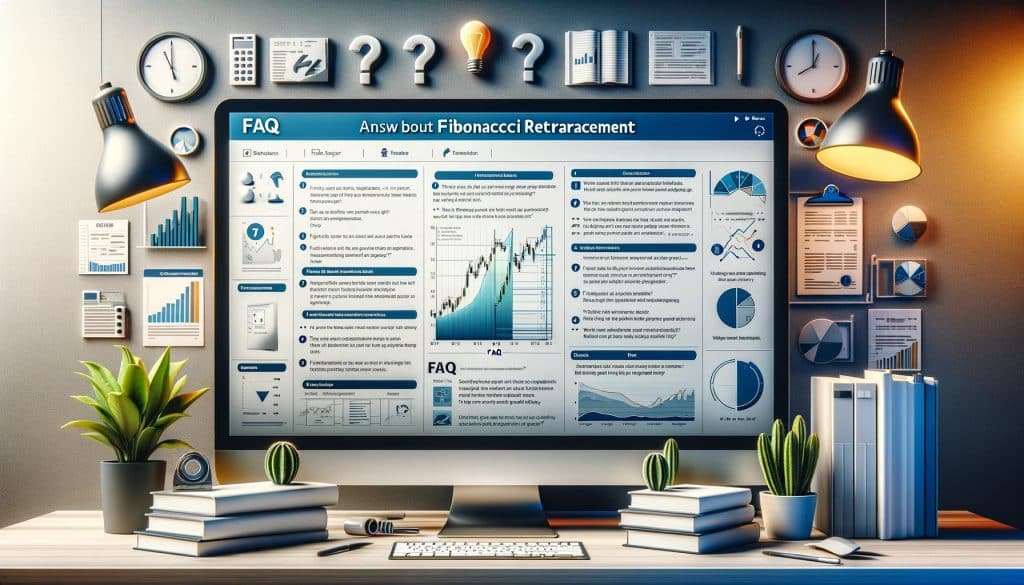
FAQs about Fibonacci Retracement
What is Fibonacci Retracement?
Fibonacci Retracement is a technical analysis tool used to identify potential support and resistance levels based on the Fibonacci sequence. These levels are horizontal lines that indicate where possible price retracements could pause or reverse.
How is Fibonacci Retracement calculated?
Fibonacci Retracement levels are calculated by identifying two extreme points (a high and a low) on a chart and then dividing the vertical distance by the key Fibonacci ratios (23.6%, 38.2%, 61.8%, and sometimes 76.4% and 100%).
Why is the Fibonacci sequence important in trading?
The Fibonacci sequence is significant in trading because it appears to reflect certain patterns in nature and human behavior, including the financial markets. These patterns help traders anticipate potential market movements.
Can Fibonacci Retracement be used in all markets?
Yes, Fibonacci Retracement can be applied across various markets, including forex, stocks, commodities, and cryptocurrencies. Its versatility makes it a valuable tool for traders analyzing different assets.
How do you draw Fibonacci Retracement levels?
To draw Fibonacci Retracement levels, select the Fibonacci tool in your trading software, click on a swing high and drag the cursor to a swing low for downtrends. Do the reverse for uptrends. The software will automatically place the retracement levels between these two points.
Do Fibonacci levels work all the time?
No, like all trading tools, Fibonacci Retracement levels are not foolproof and do not work all the time. They should be used in conjunction with other analysis methods for more reliable trading signals.
How can I integrate Fibonacci Retracement with other indicators?
Fibonacci Retracement can be integrated with other technical indicators like moving averages, RSI, and MACD. For example, finding confluence between a Fibonacci level and an RSI oversold condition might strengthen a buy signal.
What are Fibonacci Extension levels?
Fibonacci Extension levels are used to predict potential levels of interest beyond the original high and low used for the retracement. They are particularly useful for identifying profit targets during a trend.
Is Fibonacci Retracement suitable for beginners?
While Fibonacci Retracement is a powerful tool, it requires practice to use effectively. Beginners should start by learning the basics of technical analysis and practice drawing Fibonacci levels in a demo account before using them in live trading.
How do market conditions affect Fibonacci Retracement levels?
Market volatility and trends can affect the reliability of Fibonacci levels. During high volatility, markets may overshoot or undershoot Fibonacci levels, while in trending markets, these levels often act as key areas of support or resistance.
Can Fibonacci Retracement predict market reversals?
Fibonacci Retracement can help identify potential areas where market reversals might occur, but it does not predict reversals with certainty. Traders should look for additional confirmation before making trade decisions based on these levels.
How should I set stop-loss orders using Fibonacci Retracement levels?
Stop-loss orders can be placed just beyond a Fibonacci Retracement level. If entering a trade near a support level, for example, a stop loss might be placed just below that level to minimize potential losses if the level is breached.
Understanding and applying Fibonacci Retracement effectively requires time, practice, and a comprehensive approach to market analysis. It’s a tool that, when used wisely, can enhance a trader’s ability to make informed decisions in the financial markets.