

In the fast-paced world of Forex trading, the Williams %R Indicator emerges as a pivotal tool for traders aiming to navigate the volatile market with precision. This momentum indicator, created by renowned trader and author Larry Williams, is designed to identify overbought and oversold conditions, signaling potential points of market reversal. Unlike many oscillators that oscillate in a bounded range, the Williams %R Indicator does so with a unique scale from -100 to 0, making its interpretation distinct yet straightforward. This comprehensive blog post will delve into the nuances of the Williams %R Indicator, providing detailed strategies, examples, and insights to effectively incorporate it into your trading regimen.
Diving Deep into the Williams %R Indicator
The Essence of Williams %R
The Williams %R Indicator is a momentum oscillator that reflects the level of the closing price relative to the high-low range over a specific period, typically 14 days. It is inverted by design, meaning that a reading above -20 is considered overbought, and a reading below -80 is considered oversold. This inversion is a unique feature that sets it apart from similar indicators.
Calculating the Williams %R
The calculation of the Williams %R Indicator is straightforward yet insightful. It involves comparing the current closing price to the highest high and the lowest low of the past 14 periods (or however many periods the trader chooses to analyze). The formula is:
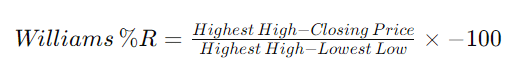
This formula outputs a value that traders use to gauge market sentiment and potential reversal points.

Applying the Williams %R Indicator in Forex Trading
Spotting Market Extremes
The primary use of the Williams %R Indicator in Forex trading is to identify overbought and oversold conditions. When the indicator moves above -20, the market is potentially overbought, and a reversal to the downside may be imminent. Conversely, when the indicator dips below -80, the market is potentially oversold, and a reversal to the upside could be on the horizon.
Strategies for Overbought and Oversold Conditions
Example of an Overbought Condition:
Imagine the GBP/USD pair has been on an uptrend, and the Williams %R Indicator climbs above -20. This signals that the pair might be overbought. Traders might look for confirmation through candlestick patterns, such as a bearish engulfing or a shooting star at this level, to consider taking a short position or exiting long positions.
Example of an Oversold Condition:
In contrast, if the EUR/JPY pair experiences a sharp decline and the Williams %R Indicator falls below -80, indicating oversold conditions, traders might await a bullish candlestick pattern, like a hammer or an inverted hammer, as confirmation to initiate a long position or cover short positions.
Utilizing Divergence for Reversal Signals
Divergence with the Williams %R Indicator can be a powerful signal of an impending market reversal. A bullish divergence occurs when the price records a new low, but the Williams %R makes a higher low, suggesting weakening downward momentum. A bearish divergence happens when the price hits a new high, but the Williams %R forms a lower high, indicating fading upward momentum.

Advanced Tips for Maximizing the Williams %R Indicator
Adjusting the Period for Different Trading Styles
While the default setting for the Williams %R Indicator is 14 periods, traders may adjust this to suit their trading style. Short-term traders might reduce the period for more sensitivity and faster signals, while long-term traders might increase the period for smoother, more reliable signals.
Combining with Other Technical Analysis Tools
For a holistic approach, traders often combine the Williams %R Indicator with other technical analysis tools. For instance, using it alongside trend-following indicators like moving averages can help confirm the trend direction, while incorporating support and resistance levels can pinpoint more accurate entry and exit points.

Conclusion
The Williams %R Indicator is a versatile and invaluable tool for Forex traders, providing critical insights into market dynamics and potential reversal points. By understanding and applying this indicator effectively, traders can enhance their ability to spot overbought and oversold conditions, capitalize on divergence signals, and make more informed trading decisions. As with any technical analysis tool, the key to success lies in comprehensive market analysis, combining multiple indicators for confirmation, and adhering to a disciplined trading strategy.

FAQs about the Williams %R Indicator
What is the Williams %R Indicator?
The Williams %R Indicator is a technical analysis tool developed by Larry Williams. It’s a momentum oscillator that measures the level of the close relative to the high-low range over a specific period, typically 14 days. The indicator moves between 0 and -100, providing insights into overbought and oversold conditions in the market. A reading above -20 is considered overbought, while a reading below -80 is considered oversold.
How can the Williams %R Indicator help in Forex trading?
In Forex trading, the Williams %R Indicator helps traders identify potential reversal points by signaling overbought and oversold conditions. It can highlight moments when a currency pair might be poised for a price direction change, offering traders opportunities to enter or exit trades. By analyzing where the indicator’s value falls within its range, traders can make more informed decisions on potential buys and sells.
Can the Williams %R Indicator predict market reversals?
While the Williams %R Indicator is effective in indicating overbought and oversold conditions, it’s important to note that it cannot predict market reversals with certainty. Instead, it should be used as part of a comprehensive trading strategy, combining its signals with other forms of analysis, such as trend, support and resistance levels, and other technical indicators, to validate potential reversals and enhance trading decisions.
How do I interpret divergences with the Williams %R Indicator?
Divergences with the Williams %R Indicator occur when the indicator’s direction diverges from the price action of the currency pair. A bullish divergence—when the price records a lower low, but the Williams %R makes a higher low—can signal that bearish momentum is waning and a potential upward reversal might occur. Conversely, a bearish divergence—when the price makes a higher high but the Williams %R records a lower high—may indicate weakening bullish momentum and a possible downward reversal. Divergences can be strong signals for reversals but should be confirmed with other analysis techniques.
What are the best settings for the Williams %R Indicator?
The standard setting for the Williams %R Indicator is 14 periods, which can be adjusted based on the trader’s strategy and the specific market conditions. Short-term traders might reduce the period to make the indicator more sensitive to price changes, capturing shorter-term trends. Conversely, longer-term traders might increase the period to smooth out the indicator’s movements and reduce the potential for false signals. Experimentation and backtesting in different market conditions can help determine the most effective settings for your trading style.
How should I use the Williams %R Indicator in a sideways market?
In sideways or ranging markets, the Williams %R Indicator can still be useful, particularly for identifying potential tops and bottoms within the range. However, since it’s primarily a momentum indicator, its effectiveness might be limited in such conditions. Traders should consider using additional tools, like horizontal support and resistance levels or range-bound indicators like the Relative Strength Index (RSI) or the Average Directional Index (ADI), to complement the Williams %R and enhance market analysis in these scenarios.
Can the Williams %R Indicator be used for setting stop-loss orders?
While the Williams %R Indicator itself does not directly provide stop-loss levels, it can inform stop-loss placement through its overbought and oversold signals. For instance, if entering a trade based on an oversold signal from the Williams %R, placing a stop-loss just below the recent swing low could be prudent, as this level represents where the market deemed the currency pair undervalued. Always consider the overall market context and your risk management strategy when setting stop-loss orders.